
This article discusses Table Tags, specifically how certain tags in tables can be used to control the appearance of a LeveragePoint Table.
After you have created a table, it may be necessary to hide data from either the chart or the table that will appear in your table slide.
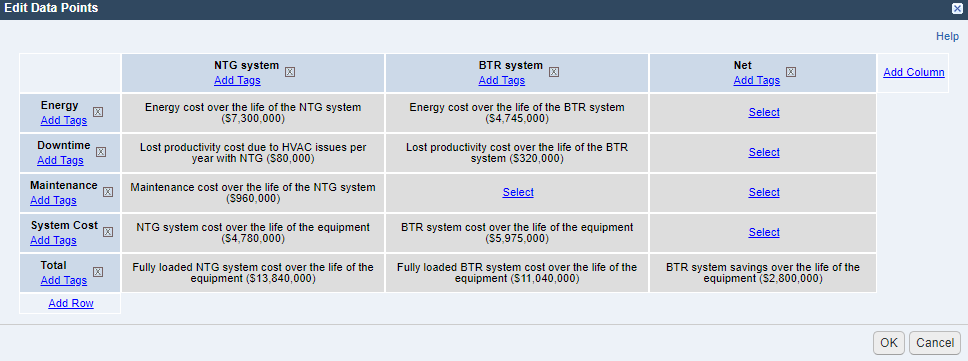
In the TCO example above, there are two columns featuring cost components of two offerings. The final row, Total, would be out of place in a stacked bar chart already showing the components of that total. Table tags are used to hide that row from the stacked bar chart.
Tags control what is shown in either the graph or the table. To add a tag, use the Add Tags link. The tags will function as follows:
- hide-table: hides either a row or column from the table.
- hide-chart: hides either a row or column from the bar chart. Hiding a column will remove the entire stacked bar representing that column from the chart. Hiding a row will remove the relevant portion from all stacked bars.
- hide-chart-label: removes chart labels from either a row or column in the bar chart.
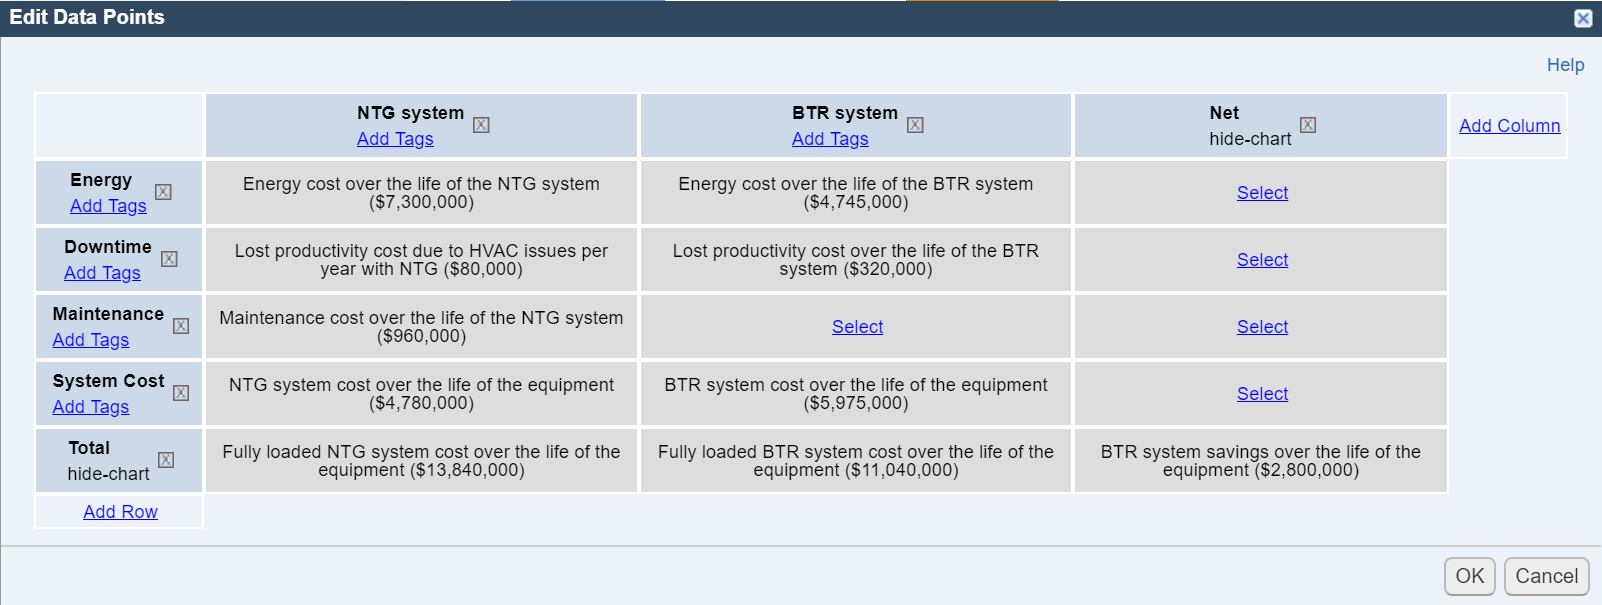
In the TCO example, the tags hide-chart would be used on the row Total and the column Net so that your table dialog appears as below:
This table would appear in the LeveragePoint tool as below:
