
The Summary is the most comprehensive part of the Value Modeling tool because it’s where you get to see all the important pieces of the value model together – Positive value drivers, negative value drivers, if you have them, and the competitor price or reference value. Additionally, you can use the Variables tab to view and manage all the variables in your value model.
The graph at the top of the Summary Tab is a visual representation of your model's economic value estimation.
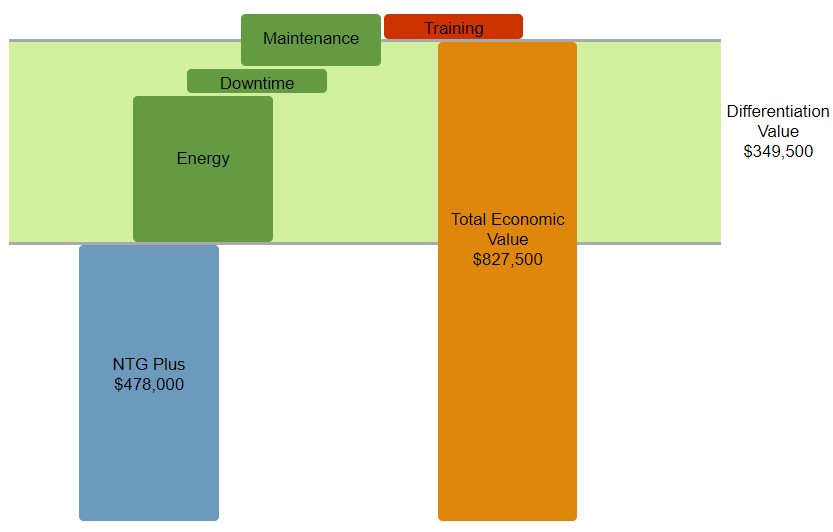
This lighter green area is called Differentiation value. It’s the net value that your offering provides. Namely, the sum of all the dark green bars (which we call positive value drivers) minus the sum of the red bars (which are the negative value drivers), again if you have them.
It’s fair to say that the higher the differentiation value, the stronger your competitive positioning is with that customer.
The orange bar, called Total Economic Value, equals the reference value, or your competitor’s offering price, plus the differentiation value. So in this example, it is $478,000 plus $349,500 equals $827,500.
You may wonder what Total Economic Value means. It represents the theoretical maximum price that a customer would be willing to pay for your offering, assuming they accepted all these value drivers. Practically speaking this is very, very unlikely. But the customer should we willing to pay more than the reference value of $478,000.