
Note: This article will discuss how to create LeveragePoint tables. For potential use cases for tables, see LeveragePoint Tables.
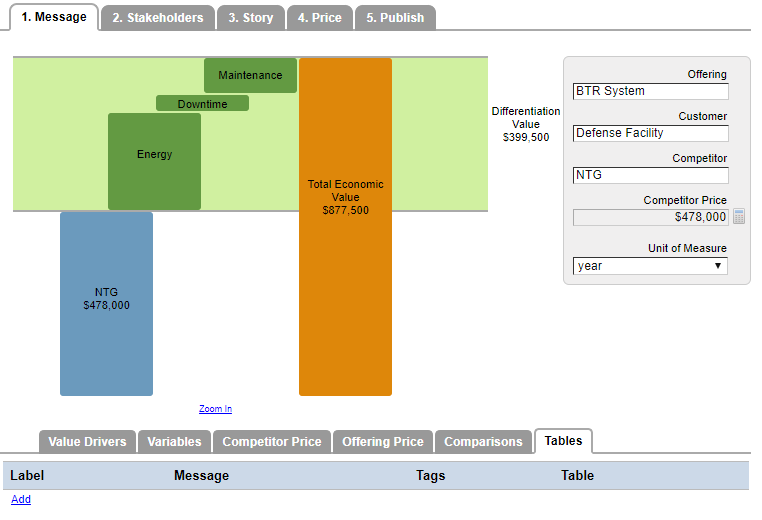
Below is an example of a common table use, a total cost of ownership (TCO) chart, from a value proposition for a fictitious company. We'll use this table as an example throughout this article.

Tables have a similar layout to the standard LeveragePoint value driver page, with a name on the top left of the screen and a message below. The key distinctive elements of this page are the table on the left and the stacked bar chart on the right. Each data point on the table in the left and the stacked bar chart on the right represent a variable from the underlying value model.
LeveragePoint provides the flexibility to selectively display data in a table and not the bar chart. While not represented in the TCO chart above, you could also display data in a bar chart that is not represented in the table.
How to Build a Table
To build or modify a table, users must use the Tables subtab under the 1. Message tab in the Value Communication tool.
To create a new table, select the Add link.
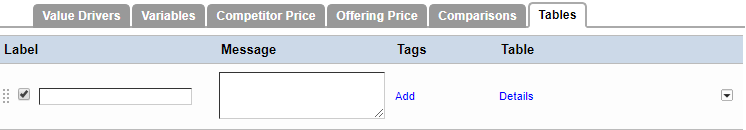
The editable options immediately available are:
- Label: the name for the table. In the table slide featured above, the label is "Total Cost of Ownership".
- Message: value message for the table. In the table slide featured above, the value message is "The BTR system results in significant fully loaded savings over the life of the equipment".
- Tags: use to categorize tables. For additional functionality with this tag option, see Table Tags.
- Details: where table slide content is selected.
Click on the Details link to open a dialog where users can build out the table and bar charts that are displayed in a table slide. Below is how an empty table will appear.
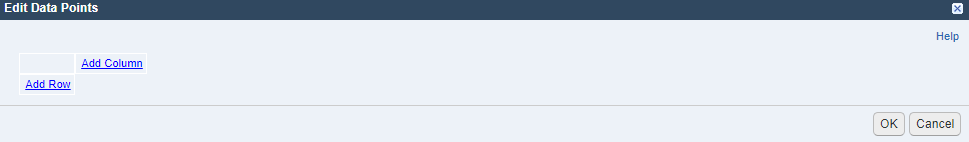
A typical table will use columns to display major categories to compare and rows to display specific variables within each major category. In the accompanying bar chart, columns will display as a stacked bar and rows represent the portions of the stacked bar chart.
Select Add Column or Add Row to add a column or row, respectively, and label them with a name.
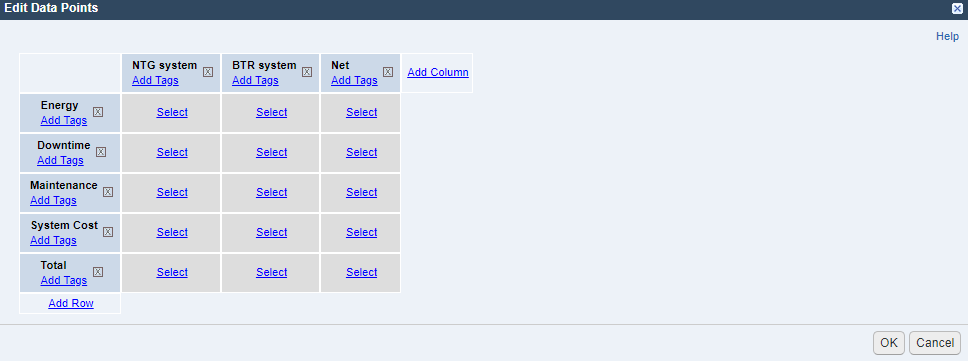
To construct the table in the TCO example above, there will need to be three columns and five rows.
Next, click the Select link to open a dialog where users can add a variable to display for each row/column pairing. Below is the variable selection dialog for the Energy row/NTG system column.
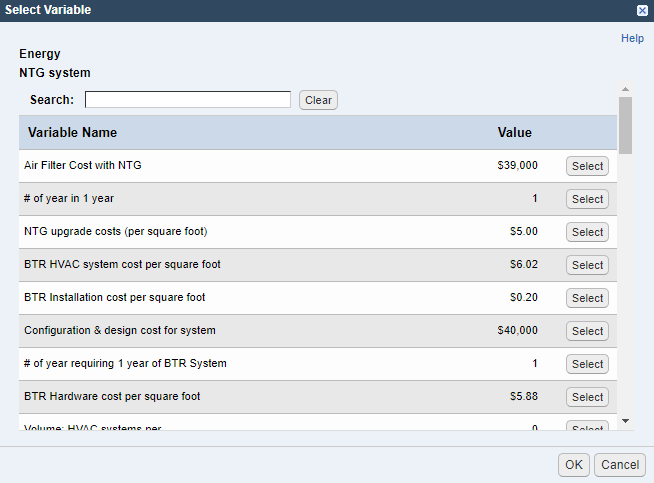
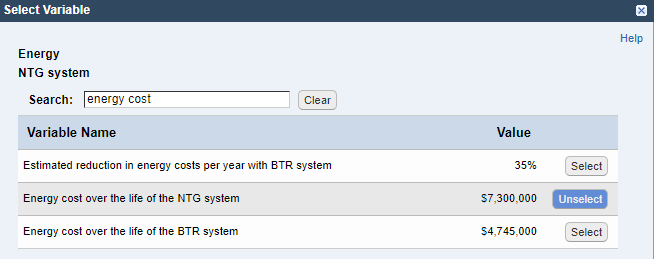
Any variable from a model can be selected in this dialog box. Narrow the list of variables using the search box, then select the relevant variable using the Select button. It may be necessary to create a new variable for a table if a relevant one has not already been created.
Note: value drivers and price components cannot be displayed in a table. It is possible to convert a value driver or price component into a subformula which can then be used in a table.
Once a variable is selected, it will appear within the constructed table as the name of the variable and its value. Below is the table from above with variables selected for each row/column combination.
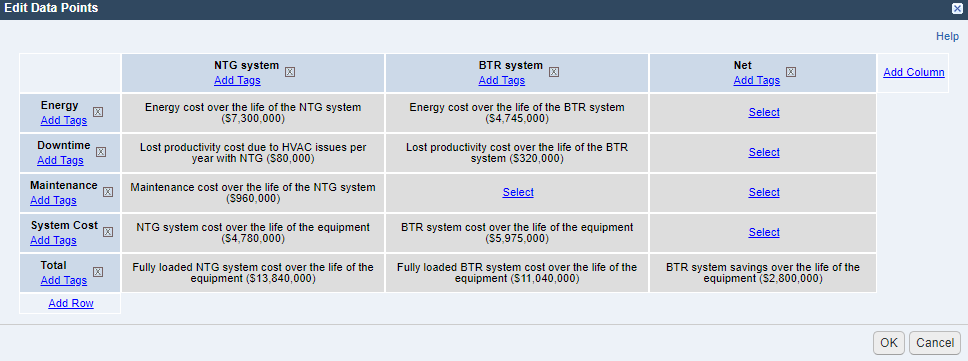
Finally, it may be necessary to hide data from either the chart or the table. In the TCO example above, there are two columns featuring cost components of two offerings. The final row, Total, would be out of place in a stacked bar chart already showing the components of that total. Table tags are used to hide that row from the stacked bar chart.
Tags control what is shown in either the graph or the table. To add a tag, use the Add Tags link. The tags will function as follows:
- hide-table: hides either a row or column from the table.
- hide-chart: hides either a row or column from the bar chart. Hiding a column will remove the entire stacked bar representing that column from the chart. Hiding a row will remove the relevant portion from all stacked bars.
- hide-chart-label: removes chart labels from either a row or column in the bar chart.
In the TCO example, the tags hide-chart would be used on the row Total and the column Net.
Note: the existing table editing function does not allow users to insert or re-arrange rows and columns. This means that it is important to consider the order or rows and columns before building a table in order to avoid having to rebuild it from scratch.