
Note: This article will discuss the make up of LeveragePoint tables and possible uses for them. For instructions on how create a table, see Creating a Table.
Users can create tables in LeveragePoint as an additional interactive method to display or capture information to further aid the effectiveness of a value proposition.
Table Use Cases
Notice that some of the daBelow is an example of a common table use, a total cost of ownership chart, from a value proposition for a fictitious company.

Tables have a similar layout to the standard LeveragePoint value driver page, with a name on the top left of the screen and a message below. The key distinctive elements of this page are the table on the left and the stacked bar chart on the right. Each data point on the table in the left and the stacked bar chart on the right represent a variable from the underlying value model.ta points from the table on the left are represented in the bar chart on the right. For example, the Energy cost for NTG system is represented by the green area in the left bar chart. You can tell that the green area represents energy by using the legend below the chart.
However, you'll also notice that some of the data points on the left are not represented in the bar chart on the right. The Total cost of the NTG system and the BTR system, represented by the last row in the table, are not displayed in the bar chart. Similarly, there are only two stacked bars in the graph, representing the NTG and the BTR total costs. There is no stacked bar for the third column, Net.
LeveragePoint provides the flexibility to selectively display data in a table but not the bar chart. While not represented in the TCO chart above, you could also display data in a bar chart that is not represented in the table.
Another common use for LeveragePoint tables are input sheets. Below is an example of an input sheet that is meant to be used prior to a customer conversation. In this scenario, the stacked bar charts are not utilized at all.
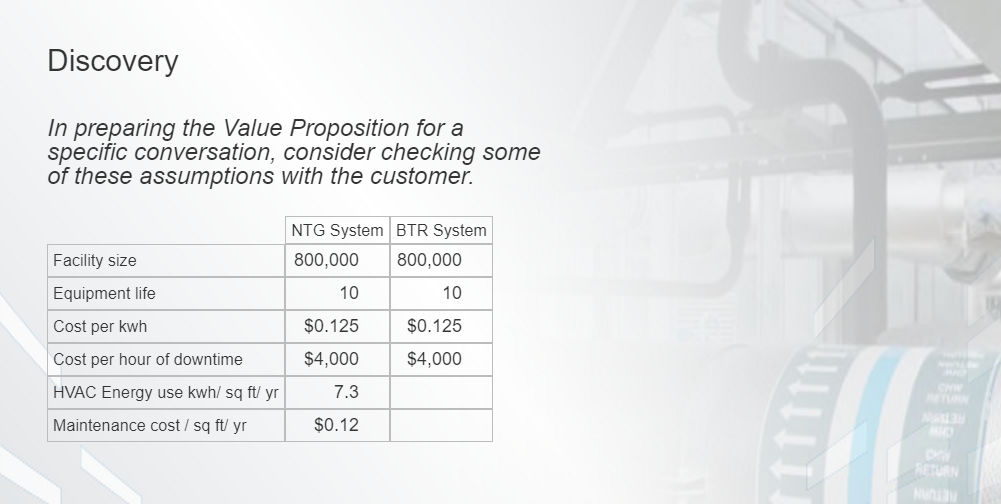
These are just a couple of potential options for how tables can be used.
How to Interact with a Table Slide
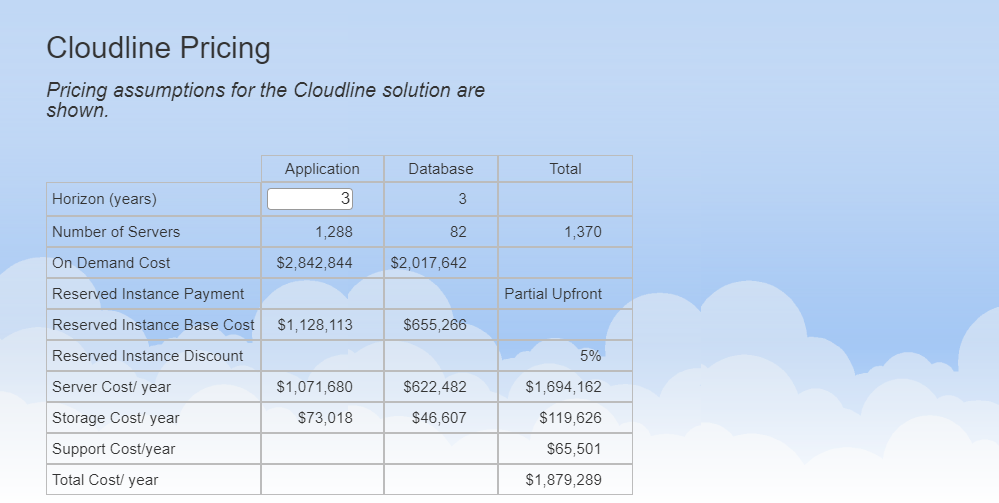
Variables within tables are editable. If the variable represented in a table slide is a data point, clicking on it will turn it into an editable field where a user can enter a new number (see row Horizon, column Application in image below).
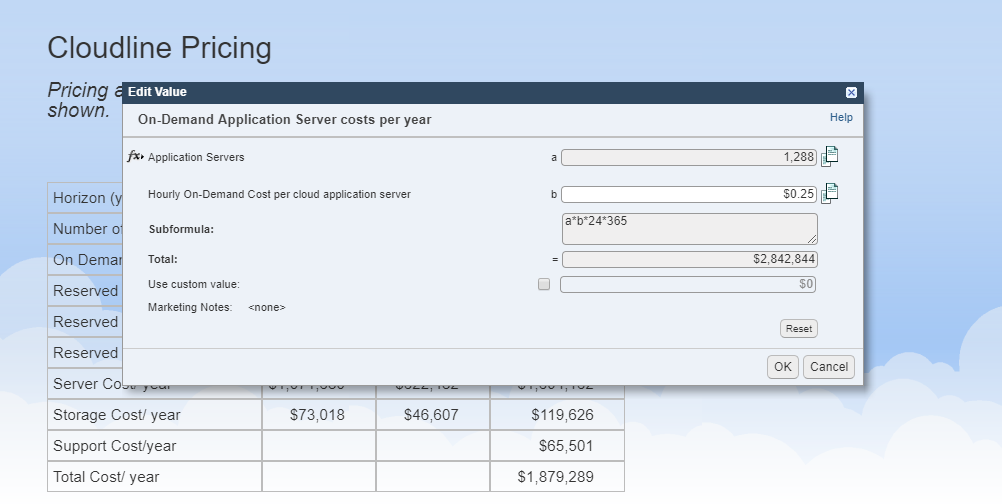
If the variable is instead a subformula, clicking on it will open the dialog box for that subformula where data is editable. In the below image, the variable under row On Demand Cost and column Application was selected.
For table slides that contain a stacked bar chart, users can hide sections of the stacked bar chart by selecting on the respective legend entry. Compare the table below to the first image in this article. By clicking on the Energy entry in the legend below the chart, the green bar slices representing Energy costs have been removed.
